Artificial intelligence does not always need more compute to understand more data. Sometimes it needs a better representation. A new study submitted to arXiv on August 7 finds that turning telecom time-series into ordinary plots can sharply reduce the number of input tokens used by vision-language models while improving anomaly detection.
The result is not a universal claim that images make AI greener. It applies to numerical sequences whose shape carries more meaning than their written serialization. Read alongside other 2026 energy research, it points to a practical rule: match the input form to the information, then measure the entire inference path.
Why telecom numbers become expensive text
The researchers studied key performance indicators from 4G and 5G cell sites. A window containing eight indicators across 381 time points expanded to between 46,101 and 59,803 text tokens, depending on the tokenizer. The same information rendered as stacked plots required between 5,442 and 16,800 visual tokens across the three tested model families.
That produced input reductions ranging from 3.6 times for Pixtral-12B to 10.4 times for Qwen2.5-VL-72B. Llama used a fixed visual-token budget, Qwen dynamically divided the image into patches, and Pixtral preserved more spatial detail with smaller patches.
The text pathway also hit a hard capacity limit. When the authors projected the workload from eight to 24 indicators, all three text representations exceeded 128,000 tokens. The visual versions remained within the tested context limits. In that setting, plotting is not merely a compression trick; it can determine whether the complete observation fits at all.
Measured savings, not just fewer tokens
The team measured GPU energy with a fixed 256-token output. On the telecom workload, the image pathway used 23,557 joules per query on Llama-3.2-90B compared with 59,751 joules for text. Qwen used 2,397 joules instead of 4,363, while Pixtral used 3,151 instead of 7,768. Those results correspond to reductions of roughly 1.8 to 2.5 times.
Accuracy did not fall in the same experiment. A fine-tuned Llama vision model reached 0.464 F1, compared with 0.185 for the text-only language model and about 0.19 for the LSTM and ARIMA baselines. The zero-shot vision version reached 0.360 F1, suggesting that the visual representation itself carried useful structure before task-specific fine-tuning.
On a public cloud-metrics benchmark, reducing plot resolution from 150 to 75 dots per inch cut visual tokens by 70 percent and measured energy by 24 percent without a meaningful accuracy loss.
TENS Analysis: representation is part of the system
The most important contribution is not that pictures beat numbers. It is that data formatting can become an energy decision. Written decimal sequences force a language tokenizer to break measurements into fragments that may preserve syntax without preserving the shape analysts care about. A plot makes trends, spikes, periodicity, and cross-series alignment available as spatial patterns.
Before shrinking a model or buying faster hardware, teams should ask whether representation inflates the workload. Logs may be better as structured events, networks as graphs, geography as maps, and some time-series as plots. Compression is valuable only when the form retains the evidence needed for the task.
The findings also show why token reduction cannot stand in for energy measurement. Visual encoders add overhead, and the study’s energy advantage was smaller than its input-token reduction. The correct unit of comparison is the completed task: energy, latency, accuracy, and failure behavior under the same output requirements.
Why output length still matters
An independent July study of five vision-language models on an RTX 3070 and Jetson Orin NX reached a complementary conclusion. It found that autoregressive decoding accounted for 86 to 97 percent of measured energy in its on-device workloads. Each output token took 11 to 39 times as long as an input token, and limiting output length saved far more energy than pruning visual tokens.
The studies are not direct contradictions. The telecom work compares extremely long numerical prompts while holding every response to 256 tokens. The edge study examines smaller models and image-description behavior where variable output length dominates. Together they separate two levers: compress inputs when representation is wasteful, and constrain outputs when generation is the larger cost.
A 2026 analysis in Joule estimated that long reasoning queries can consume about 13 times the energy of standard queries even as optimized serving lowers typical demand. Savings can therefore be erased if cheaper inputs encourage longer answers or more calls.
What remains to be tested
The August paper is a preprint, and its strongest operational claims come from a specialized telecom anomaly-detection pipeline. Results across three model families and two datasets do not establish that image conversion will help unrelated numerical tasks. Plots can also hide exact values, small deviations, or metadata if the rendering is poorly chosen.
The next test is reproducibility across hardware, batch sizes, workloads, and plotting choices. Teams should compare text and visual inputs with identical outputs, report prefill and decoding energy, and check whether compression changes which errors occur. Efficient AI will be shaped not only by better chips and smaller models, but by deciding what the machine should read, see, and say.
Sources: A Picture is Worth a Thousand Tokens research preprint; Seeing is Free, Speaking is Not research preprint; Energy Use of AI Inference, Efficiency Pathways, and Test-Time Scaling in Joule; TokenPowerBench in the Proceedings of the AAAI Conference on Artificial Intelligence.
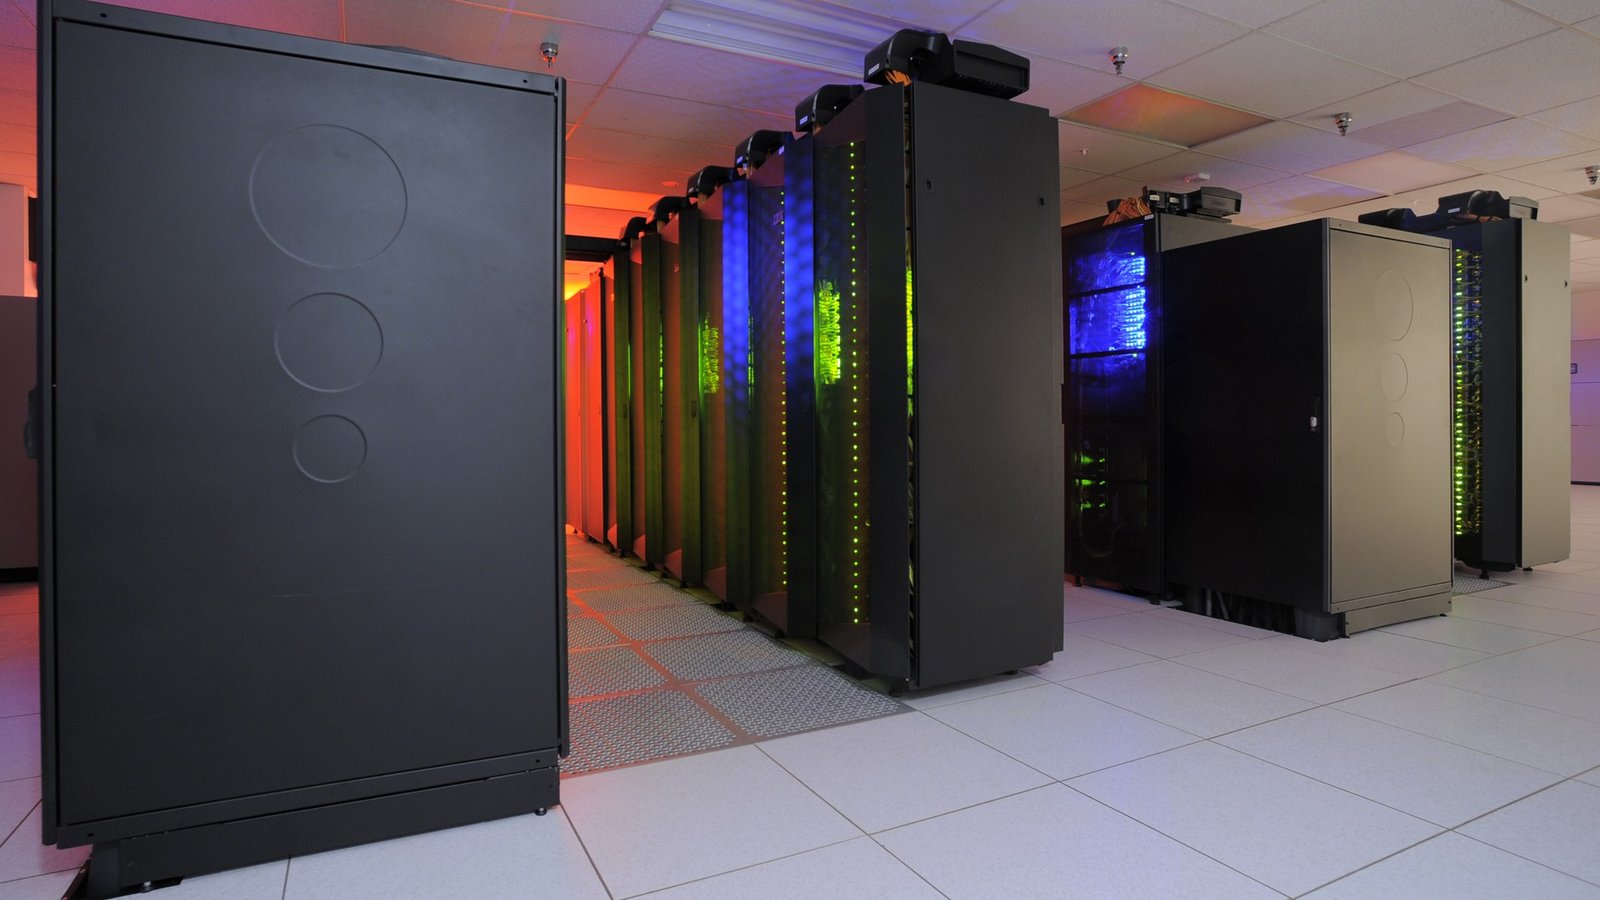
Featured image: Rows of the Discover supercomputer at the NASA Center for Climate Simulation. Photo: NASA Goddard Space Flight Center via Wikimedia Commons. Public domain, United States government work. Center-cropped from 3,312 × 1,960 pixels to 16:9 and resized to 1,920 × 1,080 pixels; no generative or substantive alteration.