
A camera can identify a vehicle without measuring what comes out of its exhaust. That distinction sits at the center of a practical question raised by MIT’s September 24 account of the new book How AI Sees the City: Urban Visual Intelligence: how should readers judge a city map whose apparent detail exceeds what its cameras directly observe?
The book, by Fábio Duarte, Martina Mazzarello, Carlo Ratti and Fan Zhang, examines how visual AI can expand urban research, alongside concerns about surveillance and bias. MIT describes applications spanning traffic, public space and greenery. The immediate development is this month’s book and the university’s new account of it; the traffic research discussed below was published in April, not this week.
TENS Magazine’s analysis is that useful visual AI needs an explicit boundary between observation, estimation and validation. Those stages can support one another, but they answer different questions. A convincing image-recognition score cannot, by itself, establish that an environmental estimate is accurate or that the resulting map represents every neighborhood equally well.
The number belongs to a particular task
MIT’s April report on research led by Songhua Hu describes a Manhattan system combining images from 331 traffic cameras with anonymized location records from more than 1.75 million mobile phones. The vehicle-recognition component assigned vehicles to 12 broad categories with 93 percent accuracy. The researchers then combined information about movement and emissions rates to estimate traffic emissions.
That 93 percent figure concerns vehicle classification. It should not migrate into a headline as the accuracy of the emissions map. The latter depends on further inputs and assumptions. A model could identify vehicles well while estimating their movement poorly; conversely, an aggregate estimate might appear plausible even when some local classifications are wrong. These are analytical possibilities, not additional findings from the study.
The primary paper in Nature Sustainability makes the importance of those inputs concrete. Its abstract reports that omitting fine-grained information, including traffic signals, speed variation or differences within the vehicle fleet, introduced average uncertainties ranging from minus 49 percent to plus 25 percent in emissions estimates. This is a comparison of modeling choices, not a universal error bar for every street or every use of visual AI.
A map should disclose its gaps
For readers, the useful comparison is therefore between the evidence behind each layer of a map. Which locations were observed? Which values were inferred from other data? Where were results checked independently? TENS Magazine proposes that these distinctions remain available alongside the finished visualization, so a precise-looking color boundary cannot silently stand in for strong evidence.
Consider a hypothetical comparison between two streets. One has frequent, unobstructed camera observations; the other relies largely on inferred traffic patterns. Coloring both with the same visual confidence would conceal a difference that matters to anyone deciding where to investigate next. A separate coverage layer could preserve that distinction without requiring readers to understand the entire model.
This proposal is consistent with the National Institute of Standards and Technology’s AI Risk Management Framework 1.0. Its core calls for documenting data representativeness, evaluating performance under conditions similar to deployment, and recording limits on generalization. The framework dates to 2023; NIST’s current page says a revision is in progress. It is an evaluation reference here, not a certification of the MIT system.
Validation has to follow the intended use
TENS Magazine would distinguish a tool used to select sites for further measurement from one used to declare a street-level emissions change. The first needs evidence that its priorities lead investigators toward useful observations. The second needs evidence that estimated changes correspond to changes outside the model. A successful trial for one purpose should not automatically count as validation for the other.
An informative trial could reserve some locations and observation periods for independent checks, then report performance separately where camera coverage is strong and weak. It could also test whether changing an input assumption changes the ordering of locations. A stable citywide total would offer limited reassurance if the list of streets marked as priorities changed substantially. These are proposed tests, not experiments TENS or the researchers have reported here.
Privacy belongs in the same design discussion. MIT says the traffic system recognizes vehicle types without compiling license plate numbers. That is a specific design choice, not evidence that every data source or future application is free of privacy concerns. For a proposed extension, TENS would ask which additional information is actually necessary for the stated measurement and what conclusions can be supported without retaining identifiable detail.
The next useful demonstration would make the chain inspectable: observed inputs, inferred quantities, independent checks and a clearly bounded purpose. Visual AI can expand the questions researchers ask about cities. Showing where the evidence ends would make its answers more useful.
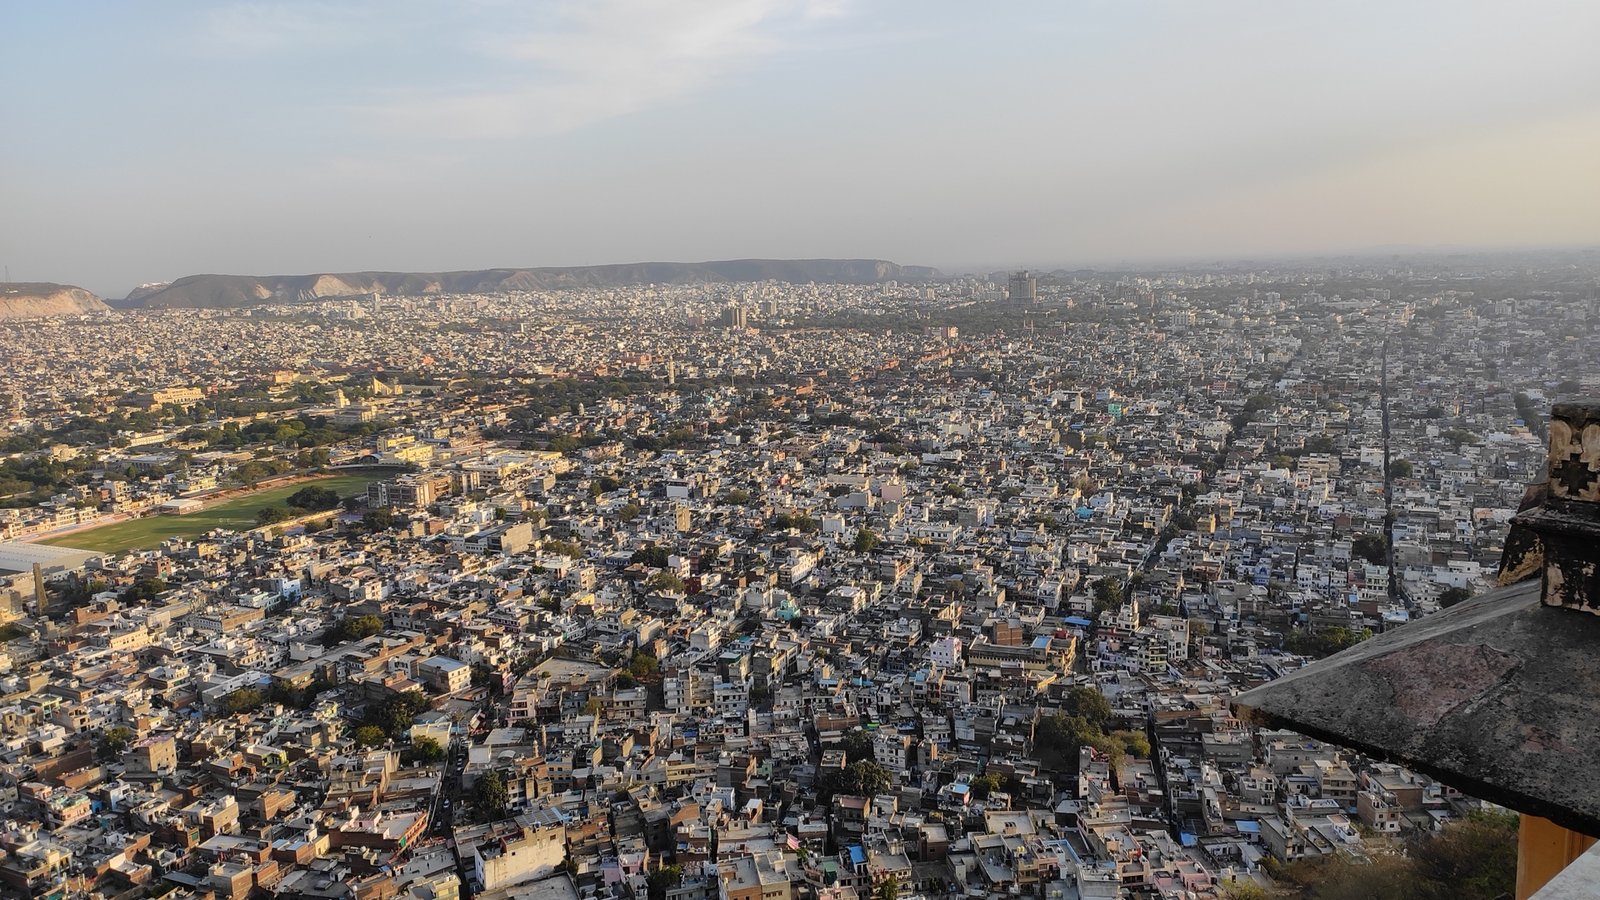
Image credit: Iloveplantsforever via Wikimedia Commons. Jaipur viewed from Nahargarh Fort, shown as urban context, not as a location tested in the Manhattan study. License: CC0 1.0 Universal Public Domain Dedication. Modifications: resized from 4,640 × 2,610 to 1,920 × 1,080 pixels; no crop, generative or substantive edits.
