Google Cloud’s latest BigQuery announcement brings a familiar statistical problem into the interface between AI agents and business decisions: an answer can be easy to generate while its meaning still requires scrutiny. The September 14 release describes six analytical functions that agents can combine to investigate changes in data. The consequential question is how faithfully those agents explain the evidence they receive.
TENS Magazine’s analysis finds a useful distinction between the product announcement, the function reference and established statistical guidance. Together, they suggest that the next quality test for automated analytics should cover the translation from a numerical output to a sentence a manager might act on.
What the new interface makes possible
Google describes tools for identifying shifts, decomposing metric changes, estimating intervention effects, measuring relationships, and examining trends and recurring patterns. They operate inside BigQuery and return structured results that can feed subsequent steps. Google also says the functions are available through its conversational analytics experience, allowing users to begin with ordinary-language questions.
The practical appeal is a shorter route from a question to a reproducible query. A team investigating a service metric could retain the analytical steps behind an answer instead of receiving only a polished explanation. That is an opportunity for better review, provided the query, assumptions and output remain available alongside the prose.
This matters because a chain of successful tool calls can look more conclusive than any individual step deserves. Finding when a metric changed, identifying the groups associated with that change and estimating an intervention’s effect answer different questions. An agent should preserve those distinctions when it combines the results.
A probability label deserves a closer reading
The documentation for the causal-effect function labels it Preview. It describes a forecast-based comparison: observed values after a specified intervention are compared with a modeled baseline for what would have happened without it. The function uses ARIMA_PLUS and does not require control series or external covariates.
The reference also defines an output named prob_causal_effect as one minus a p-value. That definition is important context for anyone reading the field as a literal probability that a particular action caused the observed change.
The American Statistical Association’s 2016 statement explains that a p-value assesses compatibility between data and a specified model; it does not give the probability that a hypothesis is true. It also cautions against making a decision solely because a result crosses a significance threshold. This is longstanding guidance, not a response from the association to Google’s release.
TENS Magazine’s reading is that subtracting a p-value from one does not, by itself, supply the missing probability about a hypothesis. A hypothetical p-value of 0.01 becomes 0.99 under that arithmetic. The numerical transformation is straightforward; interpreting it as a 99 percent chance that a chosen intervention was responsible requires justification beyond the subtraction.
This observation does not establish that the tool’s forecasts are inaccurate. It identifies a narrower issue: a software field name and its documented formula should travel together into an agent’s explanation. Otherwise, a conversational answer could imply a stronger conclusion than the underlying calculation establishes.
The baseline belongs in the answer
A forecast supplies a comparison with an expected trajectory. It cannot, merely through the name assigned to its output, rule out every other event that occurred around the same time. In a hypothetical service investigation, a product change and a shift in the customer mix could coincide. An analyst would still need to examine that context before assigning responsibility.
For an automated report, the useful addition is therefore an explicit account of the comparison: the metric, the intervention date, the historical period used and the modeled expectation. Readers should also be able to see the range of uncertainty and how much the observed values differ from the baseline. Those details make the conclusion easier to challenge or reproduce.
Google’s conversational analytics guidance provides some building blocks for that discipline. It recommends prepared, verified queries, clear definitions and carefully scoped agents. Its documentation also describes labels on agent-generated jobs that support auditing. These features address how an investigation is configured and traced; they do not automatically settle the interpretation of its findings.
A test for the whole explanation
TENS Magazine would evaluate an analytics agent with a simple review exercise: give it the same result table with the formula and assumptions available, then inspect whether its summary preserves them. Does it distinguish an estimated difference from an established cause? Does it explain what the uncertainty describes? Does it retain evidence needed to revisit the conclusion?
The September announcement makes this exercise timely because more of the investigation can now be assembled through reusable functions. The opportunity is substantial: faster analysis with a clearer record of how an answer was produced. Real progress also requires that the final sentence remain as careful as the evidence behind it.
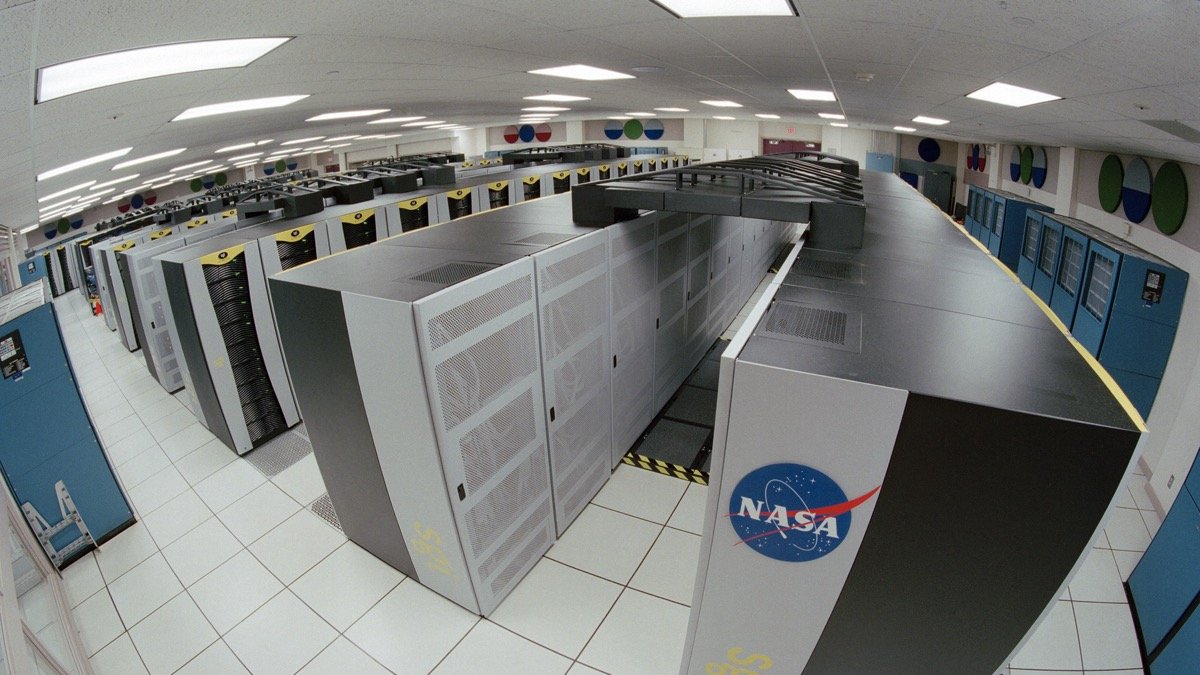
Image: Columbia supercomputer at NASA’s Advanced Supercomputing Facility, 2006. Illustrative archival computing infrastructure; not Google hardware. Credit: Trower, NASA via Wikimedia Commons. License: Public domain (PD-USGov-NASA). Modification: center-cropped and resized to 1200 × 675 pixels; no generative edits.